Note: this is part of the 18th edition of our weekly newsletter, the Databyte. To receive it in your inbox, subscribe here.
As we enter the seventh month, businesses are beginning to find their feet in the “new normal” of a post-lockdown world. For consumer businesses, one of the questions that’s increasingly been on their minds is how do they identify districts that will lead the recovery trajectory?
India’s largest private sector bank, HDFC Bank recorded a 21% jump in advances and 25% increase in aggregate deposits for the quarter ending June 2020 over 2019.
Last week, we wrote about the the credit and deposit landscape of scheduled commercial banks in India. More than 42% of credit now flows through non-PSU banks, up from 35% just two years ago. India’s top 10 districts account for more than 54% of all credit (Mumbai 22% and Delhi 13%).
This week, we’ll dig deeper into the data to identify districts that have done well.
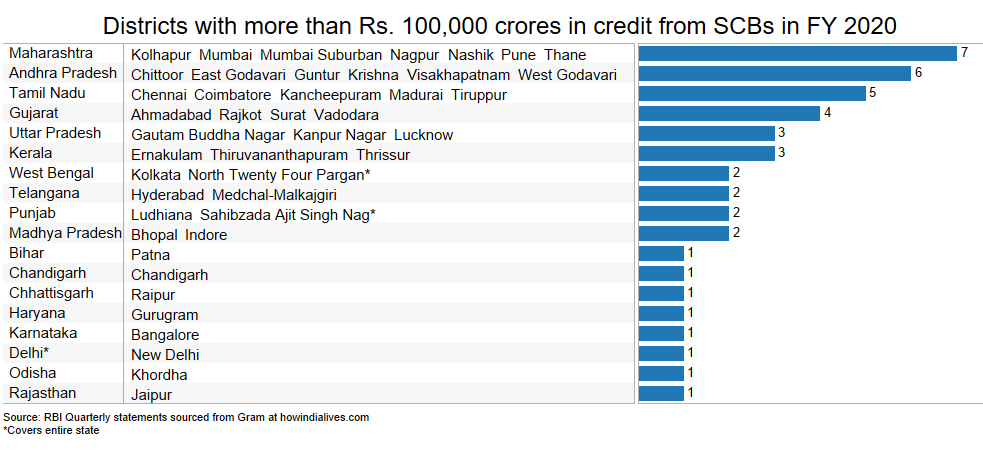
Two years ago at the end of the fourth quarter of FY 2018, 34 of 717 districts in India had credit extended by scheduled commercial banks to the tune of Rs. 100,000 crores and more. At the end of March, 2020, 10 new districts joined the ranks.
These are:
- Maharashtra: Kolhapur, Nashik
- Andhra Pradesh: Chittoor, West Godavari
- Bihar: Patna
- Punjab: Sahibzada Ajit Singh Nagar
- Tamil Nadu: Madurai
- Telangana: Medchal-Malkajgiri
- Uttar Pradesh: Kanpur Nagar
- West Bengal: North 24 Parganas
Maharashtra (7) and Andhra Pradesh (6) had the highest number of districts where credit from SCBs was more than Rs. 100,000 crores.
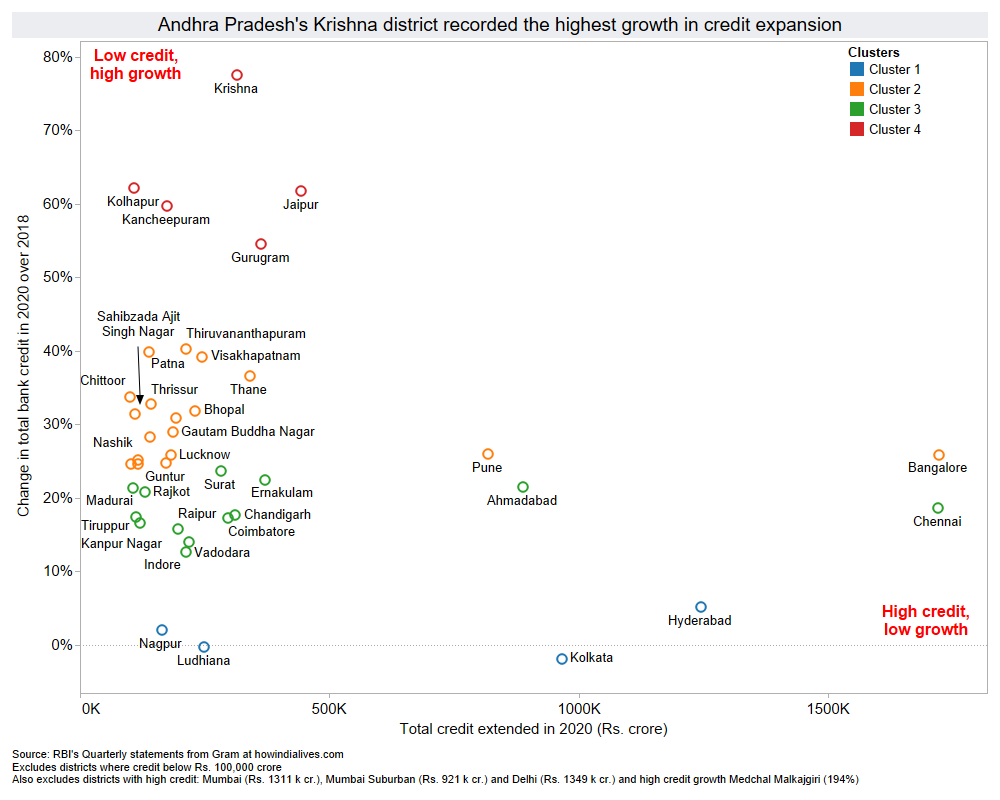
To identify the emerging hubs of increasing economic activity, we calculated the increase in credit expansion in 2020 over 2018. Visualizing this over the total credit size of the district threw up some interesting observations.
Among the larger cities, credit in Mumbai Suburban grew by 29%, Delhi (27%) and Mumbai (9%). This credit expansion was on the back of an already large credit share; credit in Mumbai Suburban is already 2 times that of Bangalore.
Plotting credit expansion against the total credit size gives us four clusters. The first cluster has Nagpur, Ludhiana, Kolkata and Hyderabad – with extremely low credit growth. While credit growth for Ludhiana has been stagnant at zero, it has actually contracted for Kolkata. In 2018, the total credit base for Hyderabad, Bangalore and Chennai was within touching distance of each other. However since then, while Hyderabad has only expanded by 5%, Bangalore (26%) and Chennai (19%) have zoomed past.
At the other end of the spectrum are districts with rapid growth in credit. Andhra Pradesh’s Krishna district, which houses its new capital Vijaywada, has seen a 77% increase in advances. Kolhapur (MH), Kancheepuram (TN), Jaipur (RJ) and Gurugram (HY) have all seen total advances grow by 50%. Both Pune, and Ahmedabad, with a modest growth, may soon displace Kolkata.
Credit-deposit ratio
Another angle to look at how credit flows into districts is through the prism of the Credit-Deposit ratio (C-D ratio). It is the ratio of how much a bank lends out from the deposits it has mobilized. This is a key metric to measure the health of a bank. It signals the importance of collecting deposits for lending, a bank’s principal economic activity. While there’s no stipulated “good” or “bad” ratio, a higher ratio indicates pressure on the bank’s resources and a lower ratio indicates that the bank is not making full use of its resources. Remember, banks have to set aside a minimum cash reserve ratio and maintain capital adequacy.
What if we were to extrapolate this measure to districts?
If Pune generates 100 rupees in deposits, how much does it receive back in terms of credit? A C-D ratio of 0.5 indicates it receives Rs. 50 for every Rs. 100 in deposits. The balance Rs. 50 flows out of the district.
Of course, a bank’s cash and capital does not adhere to geographical boundaries, especially within a country. Moreover, financing may be sanctioned through corporate headquarters, which are based in large cities and get counted there, while deposits are made in larger geographical areas.
With those disclaimers out of the way, the larger idea is not that outlandish. Among other measures, researchers have used the C-D ratio at a district level to measure regional inequality (Singh et al., 2014; Narayana D., 2003). The low credit-deposit ratio of scheduled commercial banks in Kerala has long been a subject of intense debate, with even past Chief Ministers lashing out at banks for not lending out deposits raised in Kerala within the state.
Moving on, we looked at the credit-deposit ratio in the context of the total deposits generated in FY 2020. All the three large urban centers had a C-D ratio of over 1, which indicates they lend out more money within the district than collected: Mumbai Suburban (1.41), Mumbai (1.15) and Delhi (1.029). Since these districts have extremely large credit and deposit bases, they are excluded from the map so as to not clutter the chart.
Largely, a lower C-D ratio indicates a larger appetite for credit expansion, while a much higher C-D ratio indicates a possible saturation if not supplemented by larger deposit growth.
AP’s Krishna district, had a 23% growth in deposits in FY 20 over FY 18, but recorded a 77% jump in advances. This is visible by the highly leveraged C-D ratio of 1.65.
The contrast between Bangalore and Chennai is more pronounced here. At similar credit levels, Bangalore has a larger deposit base to further fund rapid credit expansion. Chennai’s C-D ratio (1.2) is double that of Bangalore (0.6).
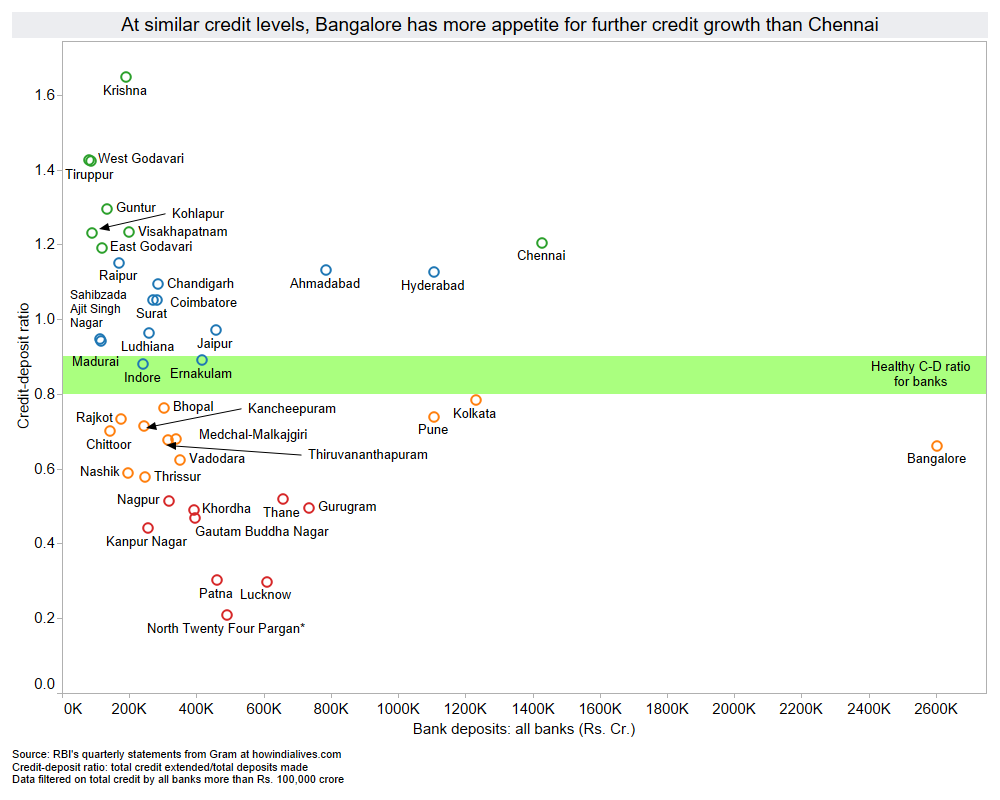
For the larger National Capital Region, despite growing deposits, credit expansion has been modest at best: Delhi (1.0), Gautam Budhh Nagar or Noida (0.47) and Gurugram (0.49). There’s plenty of room for credit expansion there.
And this is evident once you put everything we’ve found from the previous two charts together.
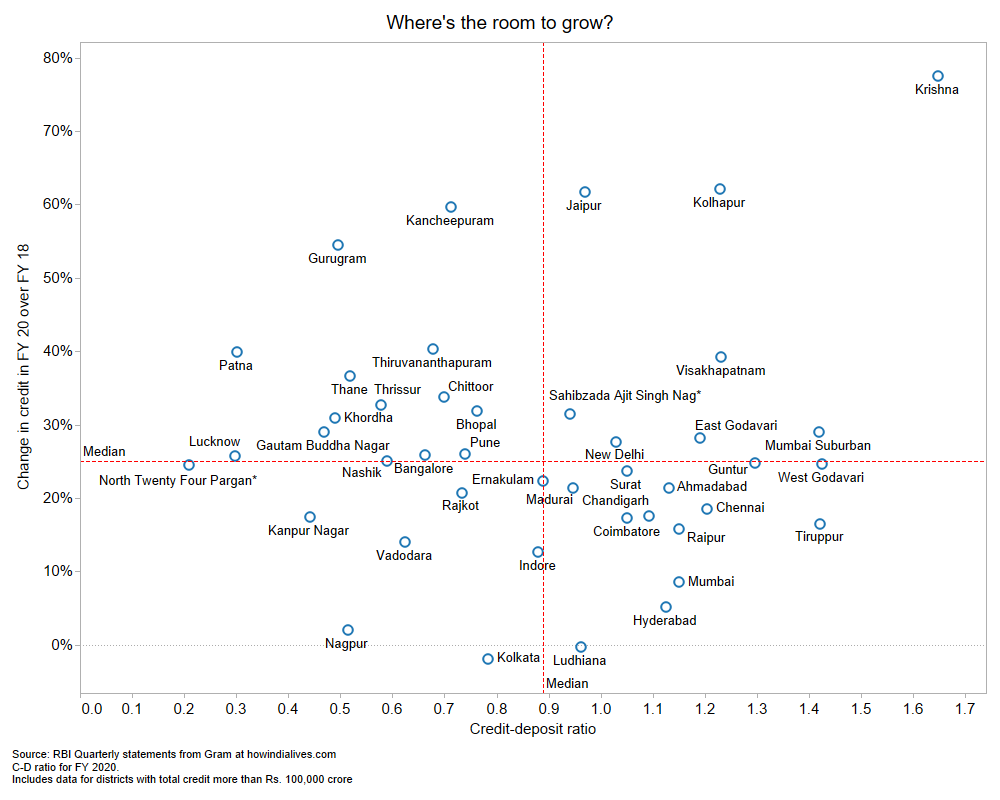
Districts in the top-left quadrant have a lot of room to absorb more credit. Districts in the bottom right quadrant have little room to absorb more credit without simultaneous expansion of deposits. Both Bangalore and Delhi are placed in a situation with modest credit growth rate and healthy C-D ratio right at the center.
As the first quarter of FY 20-21 comes to an end, these numbers will be closely monitored to identify districts which have fared well. However, do HDFC Bank’s results give any indication? I do not know, but we will definitely come back to this once RBI releases the quarterly data.
Download all data used in this edition here. To search and download all data on credit and deposits across India’s 717 districts, log on to Gram.
To get the Databyte in your inbox every Sunday, subscribe here.