Note: this is part of the 17th edition of our weekly newsletter, the Databyte. To receive it in your inbox, subscribe here.
This week is an introduction to a dataset that we use regularly at How India Lives for a range of our products and services. It gives us a sense of how credit and deposits by scheduled commercial banks shape up at the district-level. This database, released quarterly by the RBI will be added to Gram this week. Sign up for our updates on new data releases here.
Scheduled commercial banks
Scheduled banks, by definition are those that fall within the 2nd schedule of the RBI Act. They have a paid up capital of more than Rs. 5 lakh and are eligible to borrow from the RBI at typical bank rates (that’s different from Repo rates). Further, there can be two kinds of scheduled banks: commercial and co-operative. Commercial banks operate under a ‘for-profit’ purpose, while cooperatives have a ‘no-profit, no-loss’ principle.
The RBI, in a quarterly statement gives out the credit disbursed and deposits made across all districts of India by these scheduled commercial banks.
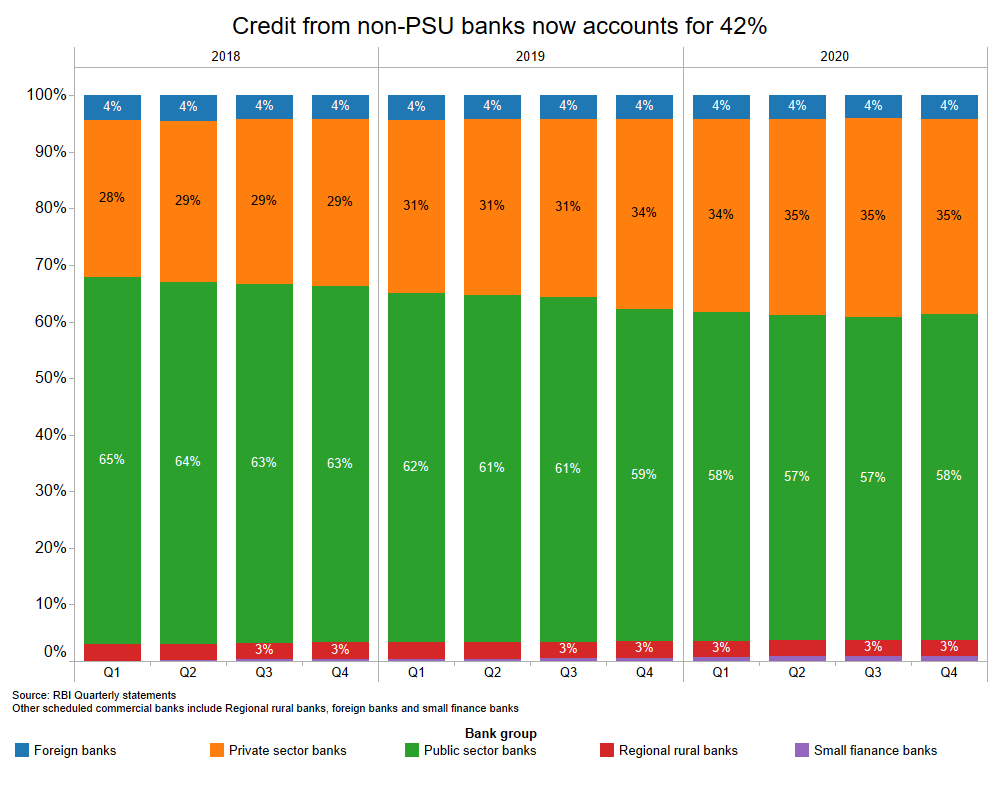
From 65% in FY 2017-18 to 57.6% in the last quarter ending in March 2020, the share of credit disbursed by public sector banks has dropped by more than 7%. The share of credit disbursed by private sector banks gained rose by 6.8%.
The other banks here include Regional rural banks, foreign banks and small finance banks. Regional rural banks, set up in 1975 to serve the rural areas with primarily agricultural lending and financial inclusion account for 3% of total credit.
Credit to districts
In the quarter ending March 2020, the total credit by all scheduled commercial banks stood at Rs. 104.5 lakh crore, up 6% from the same quarter previous year. The credit distribution, however, is skewed towards the top urban centers of the country.
Top 10 districts have 54% of the total credit flowing within the country. This leaves the other 707 districts with 46% of all credit. Delhi and Mumbai combined account for more than 35% of total credit.
Among states, Maharashtra (27%), Delhi (13%), Tamil Nadu (9%), Karnataka (7%) and Gujarat (5%) top the list.

Here, it’s important to note that these figures and distribution shares only hold true for credit to scheduled commercial bank. A large part of the credit in Indian financial system also flows through co-operatives and non-scheduled banks. This credit though, is regulated differently.
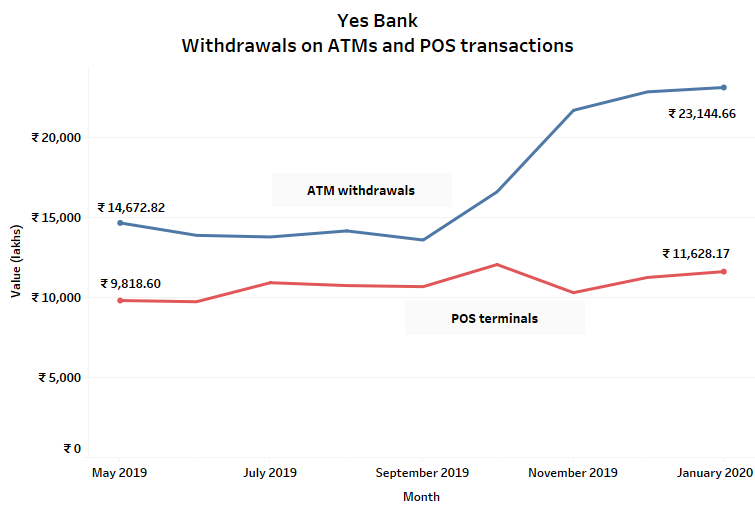
To understand one point of difference, look at the recent filing in the Delhi High court. A petitioner approached the court to ask why the Central government has infused funds into a private bank (Yes Bank) and whether it intends to do so for depositors of PMC bank (co-operative). Yes Bank depositors had full access to their money in just 12 days as the Central government and the RBI intervened in funding and permitting the reconstruction of the bank. On the other hand, for the depositors at PMC bank, restrictions on withdrawal are in place till December 22, 2020 and only on June 19, 2020 did it relax the withdrawal to Rs. 1 lakh. Almost a year since the fraud first came to light, PMC depositors still do not have full access to their money. This is one of the perils of dual regulation of co-operative banks.
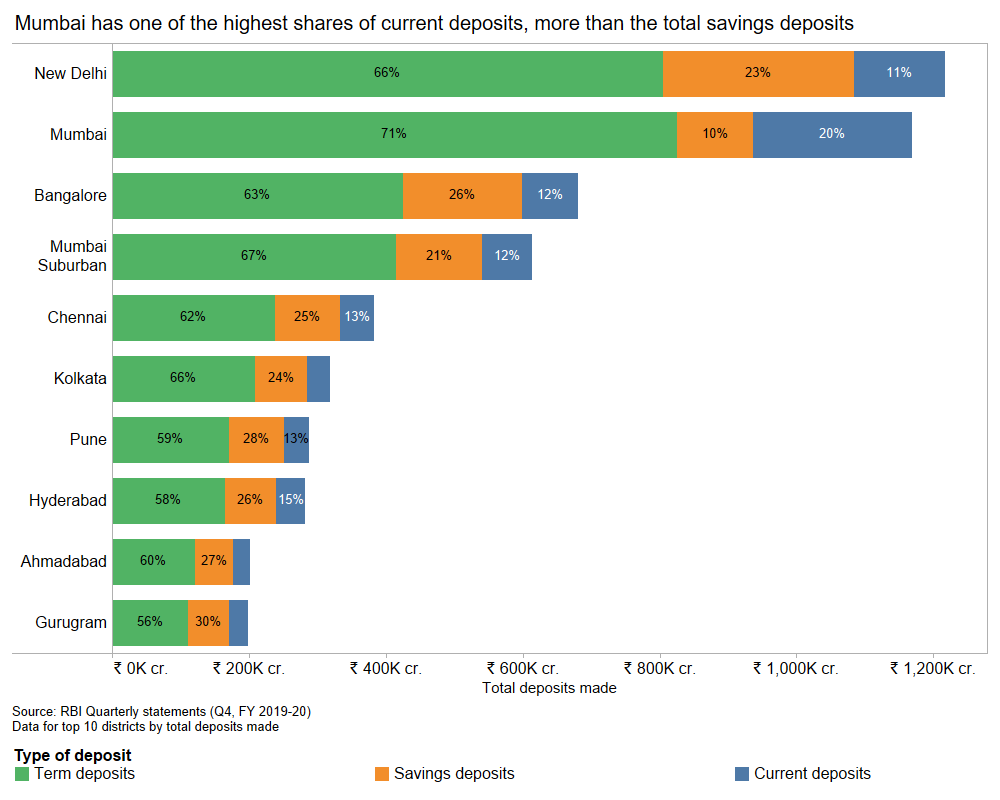
Deposits made
The other half is the deposits made and their types. The total deposits made in Q4 ending March, 2020 was Rs. 137.5 lakh crore as opposed to Rs. 104.5 lakh crore of credit disbursed. Total deposits here include current, term and savings deposits.
Over the past years, on an average about 8-9% of total deposits made were current deposits. Current deposits offer greater liquidity and ease of access and are largely used by firms and businesses. Savings deposits, on an average constituted about 32-33% and the remaining 58-60% were term deposits.
Deposits in scheduled commercial banks is also centered along the urban metros, though not as much as credit flows. The top 10 districts by the amount of total deposit accounts for 38% of all deposit.
However, among all districts, Mumbai has the highest share of current deposits (20%) higher than its total share of savings deposit (10%).
You can download all the data used in this edition here.
Credit flow by banks is a good indicator of economic activity in a district. As I’ve mentioned before, these are important input metrics in our products like the Enhanced Socio-Economic Profiler.
To get the Databyte in your inbox every Sunday, subscribe here.